
Research
Schematic Route Sketches
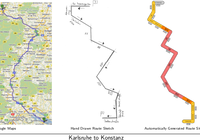 An important use of visualizations of routes in road networks is to support orientation while driving. Traditional road maps with their uniform scale give a general idea of the route, but often do not succeed in showing details of the route within the start and destination region.
Manually generated route sketches overcome this problem by showing a highly abstracted view of the route. We study the problem of automatically generating such route sketches.
»more
Schematic Metro Maps
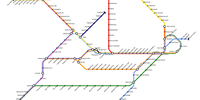 Schematic metro maps show transportation networks such as metro or subway systems in large cities. However, in contrast to regular city maps, the goal is to show the network topology nicely and clearly while geographic accuracy is less important and some amount of distortion is acceptable.
»more
Labeling of Dynamic Maps
 One of the classic problems in cartography is map labeling, i.e., the placement of textual descriptions of (point) features on a map. Dynamic maps, e.g., interactive maps in the Internet or on personal mobile devices, pose new challenges for map labeling.
»more
Boundary Labeling
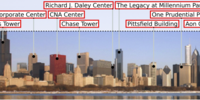 Maps or technical drawings are two examples of illustrations, where objects must be labeled in order to be comprehensible to an observer. If the image itself has not enough space for the labels, they can alternatively be placed on the image boundary and be connected to the corresponding objects by simple curves.
»more
Cartograms
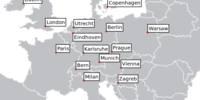
 Cartograms are distorted thematic maps, in which spatial attributes (e.g., population numbers) are represented by the areas of the correpsonding map regions. Geometrically speaking the goal is to find area-proportional contact representations of the planar dual graph of a subdivision of the plane.