Graphclustering
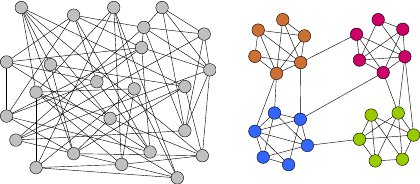
The subject of a number of research projects of mine is identifying and quantifying the clustering structure in networks. The Figure ilustrates the same network twice, once as a dog's breakfast (usually called unstructured data) and once revealing its structure. The size of instances relevant in practice can reach up to several million or even billion elements. Example topics:
- quality measures and criteria for clusterings, their behavior and properties
- algorithmic complexity of criteria, computability, optimization, approximation
- algorithmic approaches for graph clustering, heuristics
Dynamic Graph Clustering
Typically, networks change and evolve, which either impacts their clustering or might even be motivated by it. This figure shows three steps of an evolving network and its changing clustering. Example topics:
- problem setting 1: online updates of a clustering after changes in the network: quick, smooth, good, i.e., low running time, smooth transitions of the clustering when updating, negligible loss of clustering compared to static methods (in fact, we showed that it is possible to be better in all three criteria).
- problem setting 2: given an offline sequence of a changing network, analyse the temporal evolution of its clustering, find break points / critical events, track evolving clusters over time.
Network Analysis
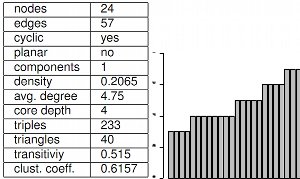
A multitude of measures and properties exist for describing networks or parts of them, and for analyzing their role and relevance. The picture shows a selection of such indices and the degree disribution for the network t the top of this page. In a broader context, this field also encompasses the simulation and generation of networks as well as their modeling. Example topics:
- mathematical modeling of problems on networks
- properties of networks, e.g., k-core decomposition, centrality measures, distributions
- generation of artificial random networks: efficiency, completeness, adherence to particular desiderata applied to, e.g., G(n,pin,pout), k-core, preferential attachment
Network Visualization
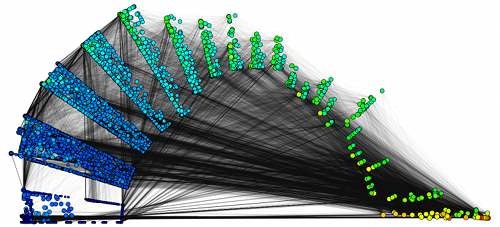
Analytic visualizations are the key to exploratory network analysis: several properties can be shown simulatneously and in the context of the network's structure. The figure shows the network of autonomous systems in the Internet, wedges of teh annulus correspond to the core-shell decomposition, colors to vertex degrees and vertex areas to centrality. The layout is determined by the edge structure (LunarVis). Example topics:
- analytic visualizations and network fingerprints
- analysis of the core hioerarchy of the AS-network and of P2P-networks
- visualizations of protein-protein similarities during medication
Applications
My research is always oriented towards theoretically sound aims and practical reason. Therefore I often use data from a number of interesting applications, both for motivating problems and for proofs of concept, examples are:
- anonymized sales data
- reaction of proteins to medication
- network of autonomous systems in the Internet
- road networks and networks of public transportation
- collaboration- and citation networks
- online social networks


