Algorithms for Label Placement in Maps and Figures
This projects is a continuation of the project Algorithms for Geovisualisation and focuses on label placement in maps and figures.
One of the classic problems in cartography is map labeling, i.e., the placement of textual descriptions of (point) features on a map. We call those descriptions labels. In this project we develop algorithms for placing labels on both static and dynamic maps. While a static map does no change after it has been drawn once, dynamic maps, e.g., interactive maps in the Internet or on personal mobile devices, may change over time.
The optimization goal for static maps is typically to maximize the number of visible labels, such that no two labels overlap each other. Translating this optimization goal to the setting of dynamic maps leads to maximizing the number of visible labels over all possible views, such that no two labels overlap each other. For dynamic maps there are additional consistency requirements. During the execution of one of the basic operations no label must suddenly change its size or position, or – to avoid “flickering” – change from being visible to being invisible and back multiple times.
The underlying challenge in labeling is not limited to maps but it can also be found in many other areas in which image features need to be annotated. Especially, in technical and scientific drawings, labels are not placed in the figure, but outside the figure, and, furthermore, are connected by thin curves with the image features. Hence, this pose new algorithmic challenges.
In the following we present ongoing projects, which also may have been started during the project Algorithms for Geovisualisation. Labeling projects that have been completed in the scope of Algorithms for Geovisualisation are not listed on this webpage.
Contact
In case of questions please contact Benjamin Niedermann.
Label Placement in Metro Maps
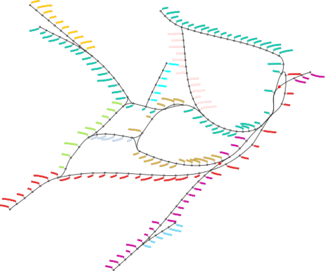
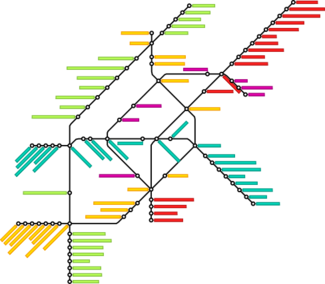
Metro maps are schematic maps for transportation networks such as metro or subway systems in large cities. However, in contrast to regular city maps, the goal is mainly to find a nice and clear layout of the network topology while geographic accuracy is less important. Hence, drawing metro maps automatically comprises two challenging steps, namely laying out the map and placing non-overlapping stations names.
In this project we consider the problem of labeling an already existing network map focusing on the application of metro maps. We present a flexible and versatile labeling model that subsumes different labeling styles. We show that labeling a single line of the network is NP-hard, even if we make very restricting assumptions about the labeling style that is used with this model. For a restricted variant of that model, we then introduce an efficient algorithm that optimally labels a single line with respect to a given cost function. Based on that algorithm, we present a general and sophisticated workflow for multiple metro lines, which is experimentally evaluated on real-world metro maps.
Publications
- Jan-Henrik Haunert, and Benjamin Niedermann
An Algorithmic Framework for Labeling Network Maps.
In: Proceedings of the 21st Annual International Conference on Computing Combinatorics (COCOON'15), Lecture Notes in Computer Science. Springer, 2015.
References
| [FHNSW12] | M. Fink, H. Haverkort, M. Nöllenburg, M. Roberts, J. Schuhmann, and A. Wolff. Drawing Metro Maps Using Bezier Curves. In: Proceedings of the 20th International Symposium on Graph Drawing (GD'12), Lecture Notes in Computer Science. Springer, 2013. |
| [NW11] | Martin Nöllenburg, and Alexander Wolff. Drawing and Labeling High-Quality Metro Maps by Mixed-Integer Programming. In: IEEE Transactions on Visualization and Computer Graphics, 17(5):626-641, May 2011. |
Label Placement in Road Maps
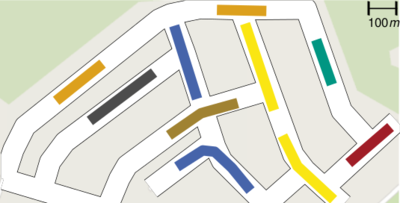
Geometrically, a road map is the representation of a road graph G as an arrangement of fat curves in the plane. Each road is a connected subgraph of G (typically a simple path) and each edge belongs to exactly one road. Roads may intersect each other in junctions, the vertices of G, and we denote an edge connecting two junctions as a road section. In road labeling the task is to place the road names inside the fat curves so that the road sections are identified unambiguously.
While in many labeling problems the number of labels is maximized, in this project we focus on the cartographic problem to place non-overlapping road labels along the edges so that as many road sections as possible are identified by their name, i.e., covered by a label. We show that this is NP-hard in general, but the problem can be solved in polynomial time if the road map is an embedded tree. Although the underlying road graphs of real-world road maps are rarely trees, our algorithm for labeling trees is still of practical interest as we show in first initial experiments.
Publications
- Andreas Gemsa, Benjamin Niedermann, Martin Nöllenburg
Label Placement in Road Maps.
In: Proceedings of the 9th Conference on Algorithms and Complexity (CIAC'15), volume 9079 of Lecture Notes in Computer Science, pages 221-234. Springer, 2015.
Full version available at http://arxiv.org/abs/1501.07188.
[ html | pdf ] - Andreas Gemsa, Benjamin Niedermann, Martin Nöllenburg
Label Placement in Road Maps.
In: Proceedings of the 30th European Workshop on Computational Geometry (EuroCG'14), March 2014.
Preprint. [ pdf ]
Trajectory Based Dynamic Map Labeling
Due to the increased availability of interactive maps on the Internet, as well as on personal mobile devices, there are new challenges for labeling those dynamic maps. Most dynamic maps allow a subset of the following three basic continuous operations: panning, zooming, and rotating.
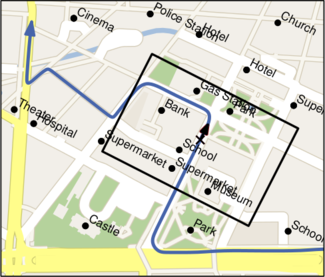
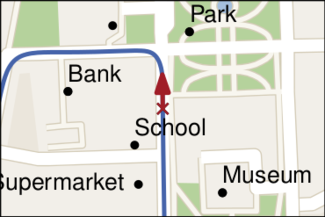
The trajectory-based map labeling is based on the continuous rotation of maps and it is a further step towards an appropriate presentation of maps on navigation systems. It is assumed that only a rectangular section of the map is displayed to the user and that this section moves along a trajectory on the map such that it is aligned according to its current position on the trajectory. In order to sustain readability, the labels are horizontally aligned with respect to the currently displayed section. Thus, driving along a road's curve means that not only the map rotates, but also the labels.
In case that the trajectory is not known from the beginning on, one needs to decide online which labels are displayed. However, in the use case of navigation systems start and destination of the planed route are often known in advance so that the complete trajectory can be used in order to obtain a consistent and optimal choice of labels. Using the assumption that the trajectory is given, we develop algorithms that present the user as much additional information as possible without cluttering single frames.
Publications
- Andreas Gemsa, Benjamin Niedermann, Martin Nöllenburg
Trajectory-Based Dynamic Map Labeling.
In: Proceedings of the 24th International Symposium on Algorithms and Computation (ISAAC'13), volume 8283 of Lecture Notes in Computer Science, pages 413-423. Springer, 2013.
Full version available at http://arxiv.org/abs/1309.3963.
[ html | pdf ] - Andreas Gemsa, Benjamin Niedermann, Martin Nöllenburg
Trajectory-Based Dynamic Map Labeling.
In: Proceedings of the 29th European Workshop on Computational Geometry (EuroCG'13), 2013.
Preprint.
Boundary Labeling
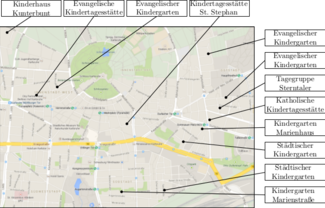
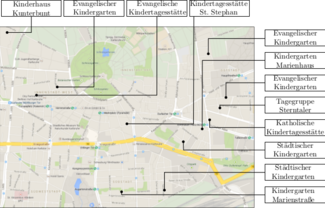
For providing information about the objects in an illustration (map, technical drawing, photo, …) one usually annotates them by a short textual description. For several reasons it might be undesirable to place these object labels inside the illustration, e.g., for lack of space or unacceptable image occlusions.
A feasible alternative is boundary labeling, a labeling method where labels are placed on the boundary of the image and connected to their corresponding objects by simple (crossing-free) leaders. In our work we restrict the leader type to straight lines or octilinear polylines with at most one bend. We optimize an objective function, e.g., the total leader length. Further, we investigate the readability of the different leader types.
Publications
- Lukas Barth, Andreas Gemsa, Benjamin Niedermann, and Martin Nöllenburg
On the Readability of Boundary Labeling .
In: Proceedings of the 23rd International Symposium on Graph Drawing (GD'15), Lecture Notes in Computer Science. Springer, 2015.
- Philipp Kindermann, Benjamin Niedermann Ignaz Rutter, Marcus Schaefer, André Schulz, and Alexander Wolff
Multi-Sided Boundary Labeling.
Algorithmica, pages 1-34, 2015.
[ html ] - Philipp Kindermann, Benjamin Niedermann, Ignaz Rutter, Marcus Schaefer, André Schulz, and Alexander Wolff.
Two-Sided Boundary Labeling with Adjacent Sides.
In: Algorithms and Data Structures, 13th International Symposium (WADS'13), volume 8037 of Lecture Notes in Computer Science, pages 463-474. Springer, 2013.
- Philipp Kindermann, Benjamin Niedermann, Ignaz Rutter, Marcus Schaefer, André Schulz, and Alexander Wolff.
Two-Sided Boundary Labeling with Adjacent Sides.
In: Proceedings of the 29th European Workshop on Computational Geometry (EuroCG'13), 2013.
Preprint

