Mapping the Veggie-Debate
Pseudogeographic Map Representations for Relational Datasets
About the Project
What one may, or must not eat is a controversial question. Some people think it's ok to eat any kind and any amount of meat. Others believe that one should reduce one's meat consumption. And still others are advocates of strictly vegetarian or even vegan diets. A variety of reasons are cited in favor of such claims – financial, culinary, animal rights and health considerations amongst others. These can be combined in different ways. Accordingly, there is a vast amount of opinions on dietary behaviors.
This data collection is part of a Master's thesis about data visualisation. It is hard to grasp the variety of opinions that are advocated in a debate, as well as relationships between them, if they are presented in textual form as a dialogue or the like. In order to make sense of these data we suggest visualizing them in form of a map. Most people are quite familiar with geographic maps and even delight in carefully examining them. We aim to make use of the geography metaphor to create a highly intuitive visualization that readily unveils the data and their underlying structure. Such an opinion map, in case of the "Veggie-Debate", could look as shown in the figure.
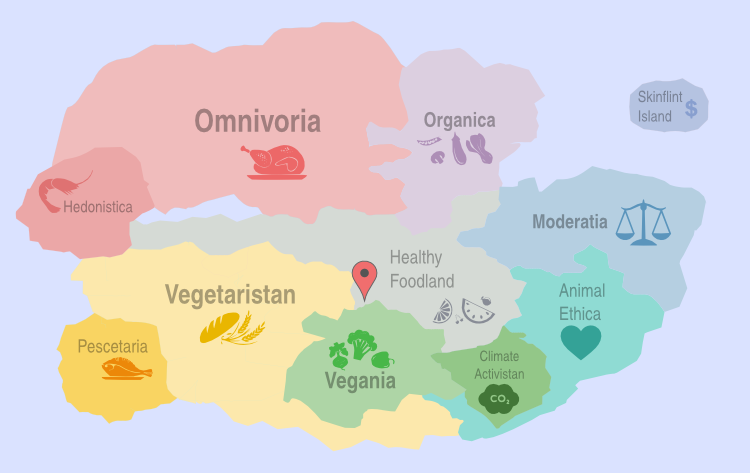
The map shown here is purely hypothetical. It was drawn by hand and is not based on real data. However, it illustrates important properties of the visualization: Similarity between opinions is captured by "geographical" distances in the map. People who share the same opinions on how a good diet looks like (as well as the same reasons for their opinion) are part of the same "country". For example, opinions that are in favor of an omnivorous diet mostly for the pleasure experience of eating are "citizens" of Hedonistica, or opinions that are in favor of a vegan or vegetarian diet because they hold that animals have a right to life are found in Animal Ethica. Furthermore, the size of countries and labels as well as the length of country borders roughly reflect the structure of the underlying "opinion space". The more opinions exist that represent the same general eating behavior, the bigger the area of the corresponding country. The length of the borders between neighboring countries corresponds to some notion of similarity between the represented eating behaviors.
This survey is used to collect opinion data that will be visualized in the map. The raw data will be published in the written composition of the thesis. The final application is supposed to run in a web browser and shall allow the user to explore the map in various ways. Users may locate themselves on the map by taking this very survey. Furthermore, they can zoom in on different opinions and see which statements were supported. Or they can highlight for example only those opinions that support core practices, such as vegetarianism, veganism, organic diets etc. The application may be a useful tool for example in online discussion forums.
Results will be published here in November 2017.
About Us
This online survey is conducted in the scope of the Master's thesis of Sophie von Schmettow, who thereby wants to conclude her Computer Science studies at the Karlsruhe Institute of Technology. The thesis, which is being written at the Institute of Theoretical Informatics, is an interdisciplinary project in the field of Digital Humanities and is supervised by members of different faculties: Dr. Tamara Mchedlidze and M.Sc. Michael Hamann of the Institute of Theoretical Informatics and Prof. Dr. Gregor Betz of the Institute of Philosophy.
If you want to know more about the project or have any suggestions or complaints, feel free to contact us.